From Food Banks to Football Stadiums: Where Data Meets Reality in Northumberland Park
In June we met for the second time with the residents of Northumberland Park in Haringey as part of our work on the JRF Insight Infrastructure Convening project focused on child poverty. Our first session was dedicated to getting to know participants and getting their initial thoughts on the concept of ‘child poverty’. As my colleague Celestin wrote following the first session, we seek to anchor high quality data analysis on the perspectives of people directly experiencing the issues the data concern. In our second session, we brought bespoke data analysis based on the discussion and interests arising from that first session.
We first discussed child poverty rates for the UK overall and Haringey and Northumberland Park in particular. The data are produced by the Department for Work and Pensions and describe the number and proportion of children who live in low income families (Children in Low Income Families, 2025).[1] The figure below shows the rate of child poverty in the UK, Haringey, and Northumberland Park from 2014 to 2023. It shows that while Haringey on average has lower rates of child poverty than the UK average, Northumberland Park specifically not only has much higher rates, but these rates have also increased more steeply since 2014/15.

Participants intuited this pattern before seeing the plot in the session. The discussion quickly went beyond the data and into the nuance of place in Haringey. One participant described a split into East and West Haringey.
“the reason why that line is as it is, is because the west part of the borough is technically more wealthy … And you can actually see that, like, if you go to Wood Green and you pass a certain place, you already know, like it feels different … when you come to the east part of Haringey from coming through the West, it's as if you're in a simulation. It actually feels like you're in two different worlds.”
They also described how the wealth disparity can be readily witnessed along the W3 bus route spanning the east-west axis, taking passengers from some of the poorest areas of the borough to some of the richest. Alexandra Palace was described as a notable intersection where the change in worlds is felt.
“once you get to that little peak, and you see, like, Ally Pally, that’s when you start coming into, ‘Oh, wow, London actually is nice!’ and you start feeling a bit ougie-bougie. And then the bougie really sets in once it goes down that hill.”
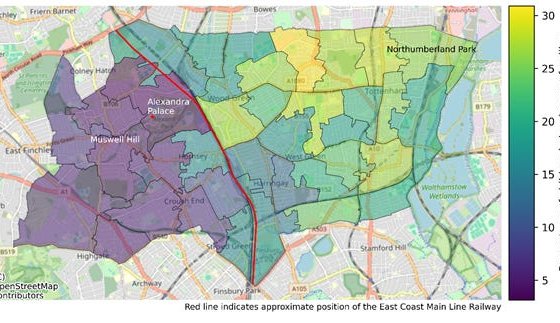
These descriptions mapped, literally, onto a visualisation we had prepared – but hadn’t yet shown the group – showing the spatial distribution of child poverty in Haringey. The transition point described by participants is evident where the blue areas on the left meet the green areas on the right. This dividing North-South line (whose approximate position is depicted in red) follows the Great Northern Route railway, which forms part of the East Coast Main Line.

The account of the geography of Haringey that participants shared was not only validated by the existing data, but also went much deeper than what can be inferred by maps alone. For example, their interpretations included reflections on the presence of Tottenham Hotspur Stadium.
After our last session, my colleague Celestin wrote about the juxtaposition of extreme wealth embodied by the stadium within the highly deprived area of Northumberland Park. In our most recent session, participants expanded on this.
Since that session, Tottenham Hotspur Stadium hosted Beyoncé on her Cowboy Carter Tour. The artist, whose net worth is estimated to be $780 million (Beyoncé Knowles-Carter, 2025), broke records at the stadium over the six shows she performed between 5 and 16 June 2025, including highest grossing concerts for any artist at over £45,000,000 (Beyoncé Breaks Her Own Record, 2025). But for residents of Tottenham and Northumberland Park, the glamour and glitz of these performances contrast strongly with the reality of life in the area and in some respects makes life harder through the disruption to services and infrastructure that events at the stadium bring.
“…I can't lie, the Beyoncé thing, and her breaking the million record thing ... And then that going on for the time it went on for. And then the way this estate had to experience disruption and the fallback from it. And then it was so funny, because she had one of her performances, and all the food banks were open. I remember walking because there was no buses, init, I was coming back late … so I had to walk ... and then there was like the food bank”.
“we have to rearrange [everything] because of the concert, the roads will be closed. It's disruption. It's just too much.”
This sharp distinction between hyper-wealth and poverty was something we aimed to investigate and discuss further with residents this time around. One question elicited from our previous conversation was: “is Tottenham unique in its positioning of a multi-million-pound stadium in an area of high poverty?”
To answer this question, we scraped the web for the names and locations of the 2024-2025 Premier League Stadiums and identified the neighbourhoods within a 1km radius of them. We then calculated the rate of child poverty in these neighbourhoods (using the same data source as above) and ranked them so that rank 1 is the area with the highest rate of child poverty in England and Wales and rank 7,264 is the area with the lowest rate of child poverty. The result of this exercise is shown in the figure below.
The vertical axis shows the stadium names and the horizontal axis represents the child poverty rank. The red vertical lines indicate the deciles where, for example, decile 1 can be understood to contain the poorest 10% of areas in England and Wales, and decile 10 can be understood to contain the wealthiest 10% of areas. The dots on the plot represent the areas within 1km of each stadium.
The areas within 1km of Tottenham Hotspur Stadium are highlighted in black for ease of viewing, and Northumberland Park is highlighted in red. The blue diamonds represent the average rank of the local authority the stadium is in. This data point helps provide a baseline for judging the extent to which inequality might be inherent in the locating of a stadium. Areas where the dots are evenly distributed around the diamond suggest that the level of poverty within 1km of the stadium is typical of the wider local authority. Areas where the dots are mostly to right of the blue diamond suggest that the level of poverty within 1km is lower than average for the local authority. Areas where the dots are mostly to the left of the blue diamond indicate places where the level of poverty within 1km of the stadium is higher than the average for the local authority.

The figure indicates that Tottenham is not unique in its positioning of a wealthy Premier League stadium in an extremely poor area; many stadia across the country appear to be located in poor areas, perhaps the result of football’s working class roots(How Football Made the Working Class, 2024), or perhaps because the land is cheaper. Throughout England and Wales there are indeed places where the level of poverty surrounding a stadium is worse than it is for Northumberland Park (e.g. Villa Park in Birmingham). In addition, looking at the position of the blue diamonds relative to the dots indicates that most stadiums are located in areas that are poorer than the average for the local authority, suggesting that this pattern in typical.
But comparing London areas to non-London areas can be misleading because there may be broader economic differences between places anyway. For example, the local authority of Birmingham has higher levels of child poverty than London boroughs. It is therefore more appropriate to compare Tottenham to other areas in London. The below figure is identical to the previous but only shows the London stadia.

Here we can see that other London stadia tend to have a more even distribution of child poverty around the local authority average within a kilometre (Emirates Stadium in Islington, London Stadium in Newham), or that areas around the stadia experience less poverty than the local authority average (Brentford Community Stadium in Hounslow, Stamford Bridge and Craven Cottage in Hammersmith and Fulham). Only Tottenham Hotspur Stadium and Selhurst Park in Croydon show the skew towards high levels of child poverty that are not characteristic of the local authority as a whole, and the case of Tottenham Hotspur Stadium is the worse of the two. So, when we consider only London, the data suggest that Tottenham is unique; most other Premier League London stadia are not located exclusively in the poorest areas of their respective boroughs.
On top of this, although developments like constructing a stadium typically come with legal obligations to mitigate their impact on the local area (commonly known as ‘section 106’ or ‘developer contributions’; see https://www.gov.uk/guidance/planning-obligations; Planning Obligations, 2019), the residents we spoke with rarely described any benefit they had directly or indirectly experienced from the presence of the Tottenham Hotspur Stadium. One mitigator related to the potential boost to the local economy that the stadium might have brought. However, residents of Northumberland Park described no evidence of such a boost for existing small businesses in the area but rather the opposite. Participants described how even those businesses that weren’t bought out or ‘relocated’ to make way for the new development saw little benefit of increased custom. Instead, stadium-goers were described to ‘parachute in and parachute out’, limiting their spending to businesses on the new development and ignoring existing businesses in the Northumberland Park area. The question of business viability in the area was something that participants were particularly interested to explore and we intend to identify datasets that can speak to this for discussion in the next session.
One of the foci of this project concerns how race factors into child poverty. When we raised this question with the residents of Northumberland Park, while ‘richer’ areas were described as ‘Whiter’ on average, there was general agreement in the group that ethnicity was not a salient differentiator between people living on the estate. Instead, Northumberland Park (and the wider area of Tottenham) was described as an ethnically diverse area where everybody’s circumstances were similar – regardless of race – and this engendered a sense of solidarity among residents that was felt to be absent in other areas.
“generally there's a mix of ethnicity in Northumberland Park, but the vibration in the entire area is the same. So, White, Black, Turkish, whichever race, everyone has suppression, low, low moods, low like, no opportunity, control from the government.”
“there's like a saying … you can find the whole world in Tottenham. Yeah, because you can go anywhere in Tottenham, you'll meet someone from somewhere you don't know.”
“when you go on that side [the west of Haringey] … you don't see the mix, or, yeah, the intertwining that you see here. And when you go over there, it's a different type of White, because here we have White ... They speak how we speak. They they're basically like us. They just happen to be White. But they experience similar circumstance – somewhat low – so they understand how it is here.”
“A lot of people you'll find in this area as well, you'll find to be selfless, like they care for others … when you go to other areas, it's very selfish. It's like for themselves. There's no mingling, per se. Do you know what I mean? There's no community there. So there's definitely a big difference in the sense of class here and class in Muswell Hill or Alexandra Palace. It's very different.”
Expanding on this further, one participant described class over race as the more salient factor shaping their experience of early motherhood in Haringey.
“when I explored motherhood and I thought I’d go to different playgroups… you expect everybody to be like ‘Hi!’ No, there’s cliques … So … I wouldn’t say it’s just race, because the same way that you could feel like isolated by a White middle class mum in that group, same with a Black middle class woman, in that they’ve made that transition.”
The final piece of data that we discussed concerned the English Indices of Deprivation, which measures relative deprivation in small areas in England across seven domains: income, employment, education, health, crime, barriers to housing and services and living environment. Each small area is ranked relative to the rest of the small areas in the country on each domain, where higher ranks indicate greater deprivation. The figure below shows a subset of these domains for Haringey. The black dots indicate Northumberland Park and the grey dots represent other small areas in Haringey.

Before showing this figure, we asked participants what they believed was the most important metric for child poverty in Northumberland Park. There was a mix of opinions, with each metric being cited by at least one person. However, income deprivation was by far felt to be the most pressing issue affecting families, with parents working extremely hard – often in more than one job – to only just make ends meet.
“People are working really hard. They put in the effort, and they don’t have enough to stay afloat, even with like, benefits and stuff.”
The sentiment that people work really hard but still struggle economically was expressed more than once, with state welfare again being described as insufficient to make a difference.
“People can’t live comfortably on benefits… Most of the people on Universal Credit are working and still not being able to survive.”
“When it’s like poverty to the point where someone’s basic needs aren’t being met, that’s not entitlement, that’s human rights.”
Employment and by extension education were felt to be relevant to the income issue. For some, education was felt to be important for employment outcomes, while for others the link was felt to be theoretical and not reflective of reality.
This latter notion was borne out by the fact that Northumberland Park ranked in the second decile for education but the first decile for employment. One participant theorised that education might act as a means for gaining employment elsewhere and leaving the area, and that this might explain the discord between the two metrics. Another remarked on the fact that nothing seems to have changed over the years despite the data evidencing the profound challenges facing people in the area.
“How much more data, data, data, do they need for them to realise ‘wait, there’s a pattern, there’s a clear problem’ … At this point, it’s not even about whether or not you live here. It’s like, whether or not you’re human.”
Housing was expressed by some as the paramount issue affecting people in Northumberland Park – both in terms of access to housing and the quality of housing. One participant explained how having secure housing is the necessary condition to enable change on any and all of the other domains of deprivation:
“If you’ve got secure, affordable housing … all of those things [the other domains of deprivation] fall into place.”
In addition to access to housing, the quality of housing was described as extremely important for people’s sense of wellbeing, self-worth and motivation, and that when people’s basic needs for quality housing are ignored there are heavy consequences for their physical and mental health, and this in turn deteriorates the social fabric of the neighbourhood.
“This estate, they’ve let it just rot, like physically speaking, they’ve let the estate rot… we can say ‘oh, people should encourage themselves, motivate themselves, to do well’ … but… when you walk out your flat and … you’re greeted first thing in the morning, while you’re trying to go work – mould. Why should you care? If gets to a point where, like as humans, if you’re not, if there’s not, like, a positive response to you, you naturally will just start spiralling yourself. And that’s what we’re seeing in the estate… people don’t care to try anymore… they’ve tried and tried and tried… you’re now at a point where it’s like ‘I might as well just try to survive as a person. I might as well try to live’ … people are surviving. People are not living.”
Spending time in conversation with residents of the Northumberland Park highlights to me how lived experience carries a sharper clarity than distant analysis. The residents offered a deep, nuanced account of the realities of life in their neighbourhood – an understanding that would be unattainable observing only the data from afar. As someone who has lived in relative financial security growing up, hearing these stories first-hand was an important and grounding experience for me, which has helped me grow both personally and professionally. Personally in connecting with and learning from people with experiences different from my own; professionally in checking the limits of experience-blind research and interpretation. Such a wealth of knowledge – more profound than any dataset alone could provide – has been shared with us in just two sessions with the residents of Northumberland Park. I look forward to seeing them all again at the next session and continuing the conversation.
References
Beyoncé Breaks Her Own Record. (2025). Tottenham Hotspur Stadium. https://www.tottenhamhotspurstadium.com/latest-news/beyonce-breaks-her-own-record-at-tottenham-hotspur-stadium
Beyoncé Knowles-Carter. (2025). Forbes. https://www.forbes.com/profile/beyonce-knowles-carter/
Children in low income families: Local area statistics. (2025, March 27). GOV.UK. https://www.gov.uk/government/collections/children-in-low-income-families-local-area-statistics
How Football Made the Working Class. (2024). https://jacobin.com/2024/02/football-soccer-working-class-history
Planning obligations. (2019, September 1). GOV.UK. https://www.gov.uk/guidance/planning-obligations
[1] This data source considers children to be dependent individuals under 16 years of age, or aged 16-19 and in full-time non-advanced education. In the absence of population estimates for 16–19-year-olds in full-time non-advanced education, for our visualisations we focused on under-16s.